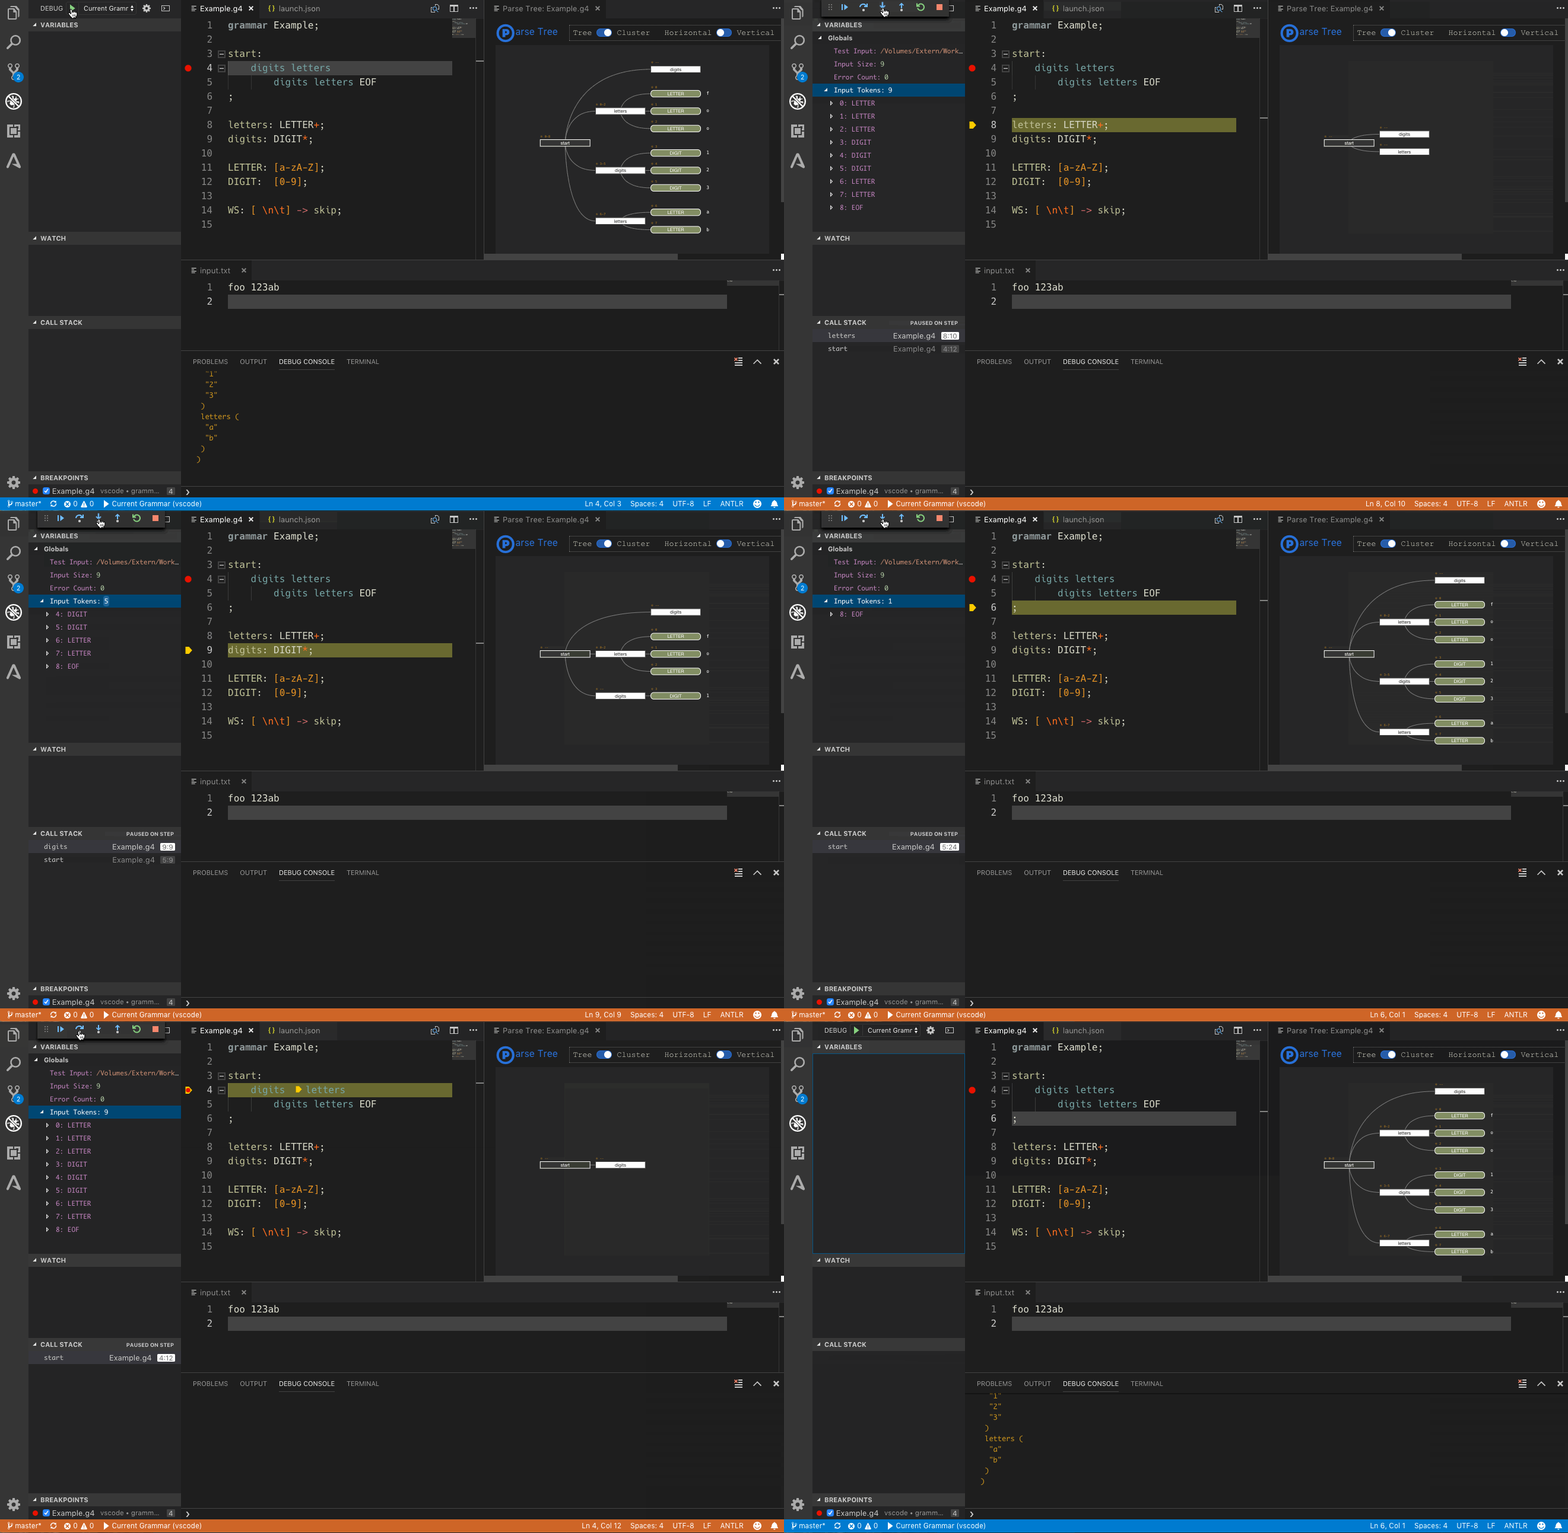
Debugging a grammar requires only a few things, since most of the prerequisites are included already. Only a valid Java installation is required to allow generating the interpreter data. Both, combined and separate grammars can be debugged, though only the parser rules can be stepped through. In either case you must have created interpreter data at least once, by saving the grammar in Visual Studio Code. See also Parser Generation for more details about generating a lexer/parser from your grammar.
- The following debug operations are supported:
- Run w/o debugging - just run the parser interpreter (no profiling yet, though it's planned)
- Run with debugging - run the interpreter and stop on breakpoints
- Step into parser rules - available while stopped at a breakpoint
- Step over lexer tokens and parser rules - ditto
- Step out of the current parser rule - ditto
Once a parse run finished a textual parse tree will be printed to the DEBUG CONSOLE panel in vscode (see the Setup section for how to enable it). This is a simple text-only representation much like a simple tree dump (but formatted).
When enabled in the launch task setup, a graphical parse tree is shown in an own editor tab, which updates on each debugging step:
This graphical parse tree is interactive. You can collapse/expand parser rule nodes to hide/show tree parts. Two possible layouts exist (horizontal and vertical) and you can switch between the standard (compact) tree layout or the cluster layout, where all terminals are aligned at the bottom or on the right hand side (depending on the layout).
As with all graphs in this extension, you can export it to an SVG file, along with custom or built-in CSS code to style the parse tree. There are 2 user settings that determine the initial orientation and the layout of the tree. You can read details in Extension Settings.
Grammars can contain code in the target language of the generated lexer/parser. This can be support code in named actions (e.g. import or #include statements), other code within rules to support the parsing process (unnamed actions) or semantic predicates, to guide the parser. The debugger will try to evaluate any such action/predicate code when it encounters it, using a standalone JS VM context. To make this work, however, this code must be written in JS.
Executing this code alone makes not much sense, usually. It often requires the infrastructure (base lexer/parser classes and so on) to interact with them. However, the debugger uses the ANTLR4 interpreter classes, which do not have access to that infrastructure. Instead you have to provide a mock up, against which action and predicate code can be executed. The mock code should reside in a plain Javascript file (no module), which is loaded into the same JS VM context where the action code is evaluated (see the Setup section for how to enable it). On every launch of a debugging session a new JS context is created with the evaluated code of the specified action file using vm.runInNewContext. Because of that you can change your mock code between debugger runs to modify the parsing behavior.
For example:
"use strict";

const version = 2;
const doesItBlend = () => true;
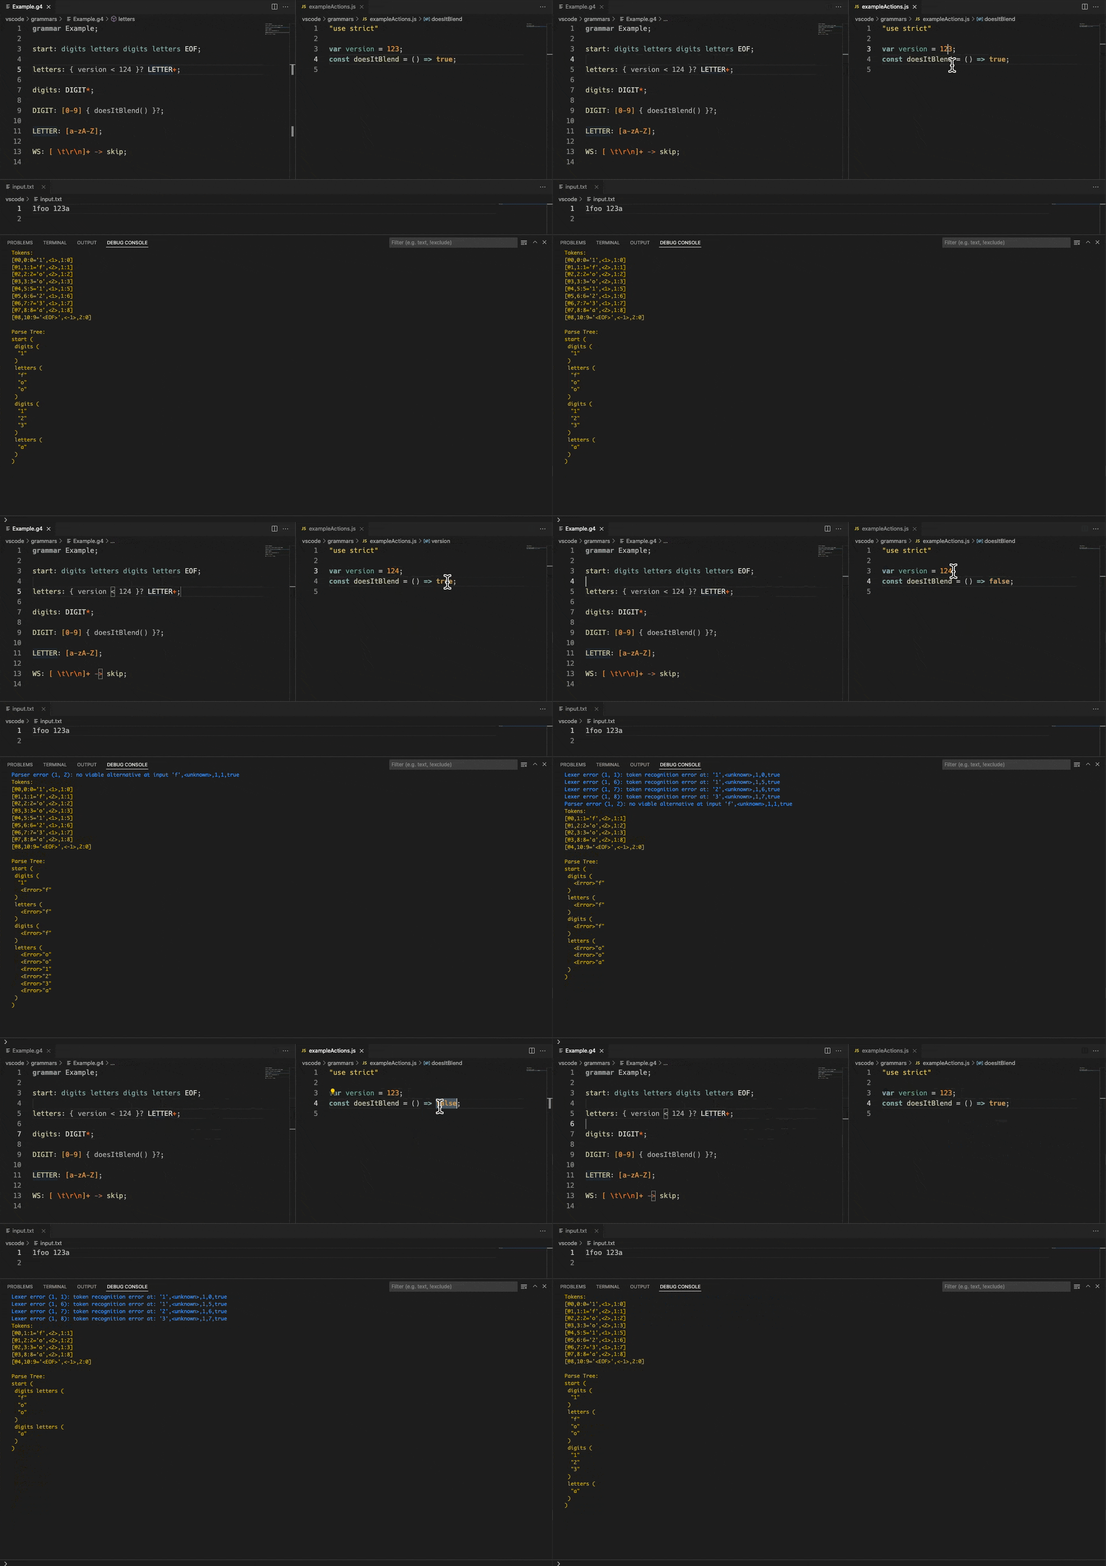
Errors during execution are reported back to get a chance of fixing any problem. With that action JS file in place you can then use semantic predicates as shown in this animation:
What is needed to debug a grammar?
- The grammar obviously, either as combined grammar (with parser and lexer rules in a single file) or separate grammars. Note: grammars which require a special setup (e.g. a different base class than the standard
LexerandParserclasses) could be a problem. It depends on what code is used from such base classes. Maybe you can emulate that also using the mentioned action/predicate JS file. - Code generation must be enabled in the vscode-antlr4 settings or no interpreter data is generated. In the user preferences set ['antlr4.generation']['mode'] to either 'internal' or 'external' (default is 'internal').
- The interpreter data must be generated and current. Simply save your grammar in vscode to accomplish that.
- A test input file. This can be any file provided it can be read by the lexer interpreter to generate tokens from and can be located anywhere. You can specify a relative or absolute path for it in the launch configuration. Paths are resolved relative to your workspace.
- Optionally an action file for semantic predicates.
- A launch config in vscode to configure your debug sessions.
A typical launch config looks like this:
{
    "version": "2.0.0",
    "configurations": [
        {
            "name": "Debug ANTLR4 grammar",
            "type": "antlr-debug",
            "request": "launch",
            "input": "input.txt",
            "grammar": "grammars/Example.g4",
            "actionFile": "grammars/exampleActions.js",
            "startRule": "start",
            "printParseTree": true,
            "visualParseTree": true
        }
    ]
}
The value for type must be "antlr-debug" to denote a debug configuration for ANTLR4 grammars. For request "launch" must be set (attach is not supported and doesn't make sense, since we have no process to attach to). A name for the config is also mandatory as well as the name of the test input and the grammar file. The rest of the options is optional. The actionFile parameter refers to a file that must be structured as described in the Actions and Semantic Predicates section. All file entries can use variables to specify the file loaded in the current editor or specific folders etc.
If the variables provided by visual studio are not sufficient, the project Command Variable can help.
Example:
{
    "version": "2.0.0",
    "configurations": [
        {
            "name": "Debug ANTLR4 grammar",
            "type": "antlr-debug",
            "request": "launch",
            "input": "${fileDirname}/${fileBasenameNoExtension}.input.txt",
            "grammar": "${file}",
            "startRule": "grammar",
            "printParseTree": true,
            "visualParseTree": true
        }
    ]
}
Example of the use of Command Variable:
{
    "version": "2.0.0",
    "configurations": [
        {
            "name": "Debug ANTLR4 grammar",
            "type": "antlr-debug",
            "request": "launch",
            "input": "${fileDirname}/${fileBasenameNoExtension}.test.txt",
            "grammar": "${file}",
            "startRule": "${input:fileBasenameNoExtensionLowerCase}",
            "printParseTree": true,
            "visualParseTree": true
        }
    ],
    "inputs": [
        {
          "id": "fileBasenameNoExtensionLowerCase",
          "type": "command",
          "command": "extension.commandvariable.transform",
          "args": {
            "text": "${fileBasenameNoExtension|lowerCase}"
          }
        }
      ]
}
To tell the interpreter where to start parsing we need a start rule. You can omit that, in which case the interpreter starts with the first parser rule in the grammar. However, specifying it allows to parse only a sub language (say, only expressions) or other subrules, instead of the entire possible language. A great possibility to focus only on those parts of your grammar that need fixing.
The 2 boolean parameters determine visualizations. The entry printParseTree causes the debugger to print a textual parse tree to the DEBUG CONSOLE window, after a debug session has finished. The visualParseTree parameter however lets it generate a graphical parse tree that will grow on each debug step.
Breakpoints can be set for parser rule enter and exit. Currently no intermediate lines are supported. Breakpoints set within a rule are moved automatically to the rule name line and act as rule enter breakpoints. If rule enter and exit are on the same source line exit takes precedence.
During debugging the following parsing details are shown:
- Variables - a few global values like the used test input and its size, the current error count and the lexed input tokens.
- Call stack - the parser rule invocation stack.
- Breakpoints - rule enter + exit breakpoints.
-
The debugger uses the lexer and parser interpreters found in the ANTLR4 runtime. These interpreters use the same prediction engine as the standard classes, but cannot execute any target runtime code (except for action/predicate code as described above).
-
The interpreters are implemented in Typescript and transpiled to Javascript, hence you should not expect high performance parsing from the debugger. However, it should be good enough for normal error search.
-
Left recursive rules are pretty special and influence the way incremental visual parse tree are created. Recursive rules cache generated parser rule contexts until they are done. Only on exit they unroll and actually update the generated parse tree. Because of that no change can be displayed in the graphical parse tree before a recursive rule is left.
-
Parser rule context variables, parameters and return values cannot be inspected, as they don't exist in the interpreter generated parse tree.
-
The debugger implements a simple look ahead for upcoming symbols to guess what the next debugging step might end at (for stack trace generation, which also influences the caret position and debug marker in the editor). This is independent of the internal prediction process for ATN states (which is used for parsing). This approach often returns more than a single candidate for the next debugger step, because the actual path which is taken depends on the following input (which the debugger does not know yet). Because VS Code only can have one entry per stack frame, always the first candidate is used, which might lead to unexpected debug marker positions. This effect is most prominent in left recursive rules, but can also be seen in situations where optional rule invocations are used. Maybe at a later point also for debugger symbol look up more lookahead will be used to avoid this problem.

