
Real-time dashboard for Optuna. Code files were originally taken from Goptuna.
You can install optuna-dashboard via PyPI or Anaconda Cloud.
$ pip install optuna-dashboard
First, please specify the storage URL to persistent your study using the RDB backend.
import optuna

def objective(trial):
    x = trial.suggest_float("x", -100, 100)
    y = trial.suggest_categorical("y", [-1, 0, 1])
    return x**2 + y

if __name__ == "__main__":
    study = optuna.create_study(
        storage="sqlite:///db.sqlite3",  # Specify the storage URL here.
        study_name="quadratic-simple"
    )
    study.optimize(objective, n_trials=100)
    print(f"Best value: {study.best_value} (params: {study.best_params})")
After running the above script, please execute the optuna-dashboard command with Optuna storage URL.
$ optuna-dashboard sqlite:///db.sqlite3
Listening on http://localhost:8080/
Hit Ctrl-C to quit.
Please check out our documentation for more details.
You can also use an official Docker image instead of setting up your Python environment. The Docker image only supports SQLite3, MySQL(PyMySQL), and PostgreSQL(Psycopg2).
$ docker run -it --rm -p 8080:8080 -v `pwd`:/app -w /app \
> ghcr.io/optuna/optuna-dashboard sqlite:///db.sqlite3
MySQL (PyMySQL)
$ docker run -it --rm -p 8080:8080 ghcr.io/optuna/optuna-dashboard mysql+pymysql://username:password@hostname:3306/dbname
PostgreSQL (Psycopg2)
$ docker run -it --rm -p 8080:8080 ghcr.io/optuna/optuna-dashboard postgresql+psycopg2://username:password@hostname:5432/dbname
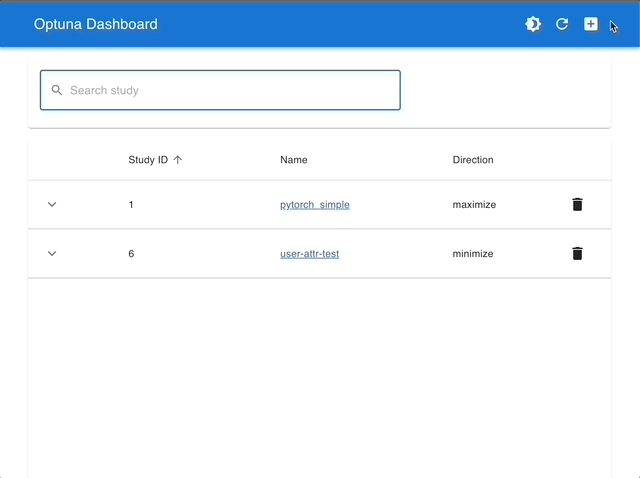
You can create and delete studies from Dashboard.
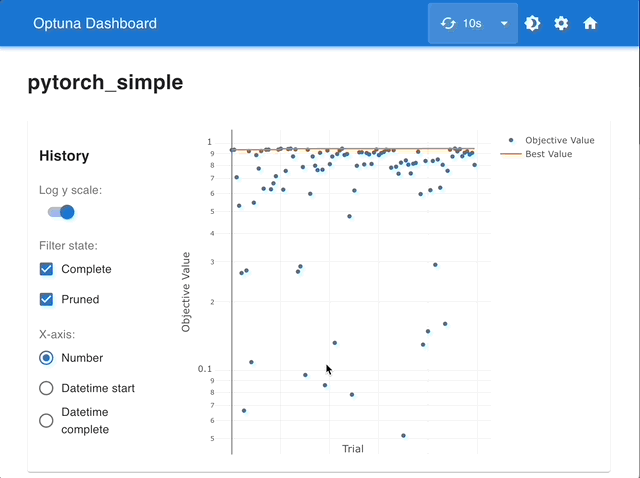
You can check the optimization history, hyperparameter importances, etc. in graphs and tables.
If you want to contribute, please check Developers Guide.